Reports
QUICK START:
Process Description:
The Reports application is your 2nd level to get information out of P2. The primary way to get information is simply off the grids in the various applications as you can sort, exclude/include data. The reports can give you more information and can be exported to EXCEL to manipulate the data further.
There are three tabs types of reports in P2.
User Reports allows the food bank to create its own custom reports. These can also include copies of the system reports.
System Reports are provided by Primarius and cannot be changed, however they can be copied into a User Report and then data fields can be added/removed by the user.
Analysis Reports will put the data directly into an excel spreadsheet. The analysis shows a summary and also displays the raw data which can be used to create a user defined pivot table in Excel. These analysis reports are pre-configured and multiple queries are linked together. They are intended for you to make a copy which then becomes a User Report allowing you to add/remove elements and fields.
In Classic Primarius you could not remove/add fields to reports resulting in information on a report you didn't necessarily need. In P2 grids are all customizable. For example, in Classic there is a Receipt Summary report that has a field displayed for VAP but if your food bank doesn't use VAP it means nothing to you but it still shows up. In P2 you can uncheck the VAP field and it's removed from the grid.
The food bank has the ability to run Food Bank Reports or Agency Reports. The agency reports allow the food bank to monitor the agency activities such as amount of product received and distributed. The agency will also be able to view it's own reports through PWW. The reports must be created by the food bank, an agency cannot tailor it's own reports, only run them. When you set up permission in the system roles it's important to remember if you have a user that cannot view an agency they will not be able to use any reports that say Agency or view any reports that have Agency as a tag.
Process:
The main page displays any Active reports. There are options to view the inactive reports, perform an advanced search, export data and to add a new report. There are a couple of important columns displaying on this page. The Visible to Me Only when you create a report you can flag it to only be seen/used by yourself it will not appear on any other users screen.
Select one of the three tabs depending on the type of report to run. There is an option to copy a system report over to the User Report tab where it can be tailored to your individual food bank needs. This shortcut is to help streamline the report process. With a User Copy of a report you can add or remove fields and elements. The Reports Slides are going to give you more examples of how to use reports. For more advanced reporting functions please refer to the Metadata slides.
Add New Report
Click +Add New Report and select either Add Food Bank Report or Add Agency Report (When creating an Agency Report uncheck Allow Users to Change Filters on any filters you add).
Any report created using Agency Report will allow the agencies to see the report via PWW. The information the agency sees will only be for their specific agency. They cannot view other agencies, however if the food bank runs that report they will see all agencies.
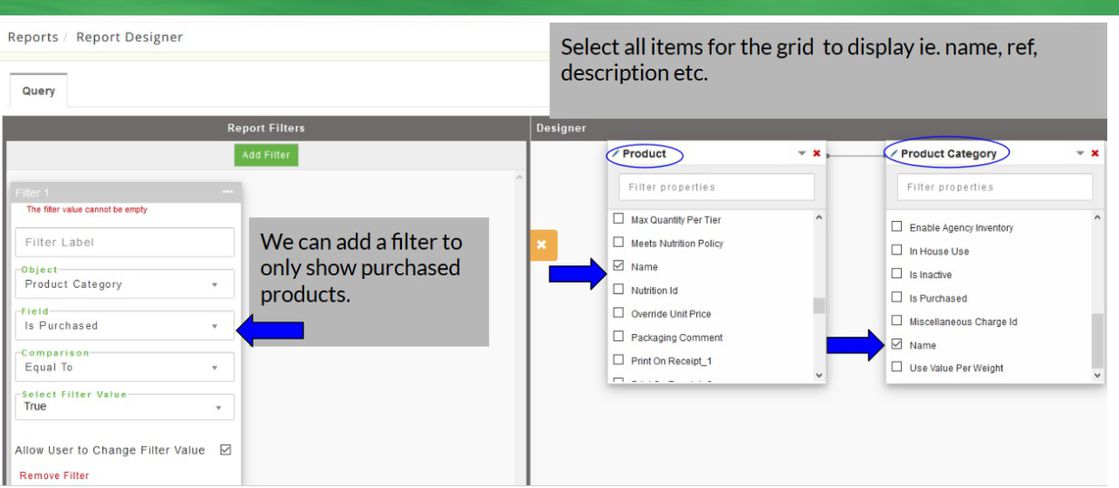
When you are creating reports from scratch you will need to determine what information you are looking for before adding a new report. When you first open the Available Reports Element from the Query menu you are presented numerous choices, however once you select the first Report Element anything that does not pertain to it will be removed from the remaining choices. (For example, if you select Access Roles, you will not see an options for A/R Balances since it does not relate to an access role). If you select no fields you will return no results. The field choices are NOT filters, they are strictly used for the grid display. You may have a field that has no information and it will be blank.
After you've selected all of your elements and fields to display you have the option of adding functions to fields such as sum or count. If the results are numeric it can display totals as well. Then there is an option of adding a filter. When you add a filter you need to select the Object to filter. For instance if you chose Agency A/R View, you can use a filter to show only agencies with a balance greater then 500.00. The field names can also be changed. You can run filters for dates such as between this date and that date or filter on all events after a specific date, you can filter for an agency, or agency type, Inactive agencies, really anything can be filtered to include or exclude in the results.
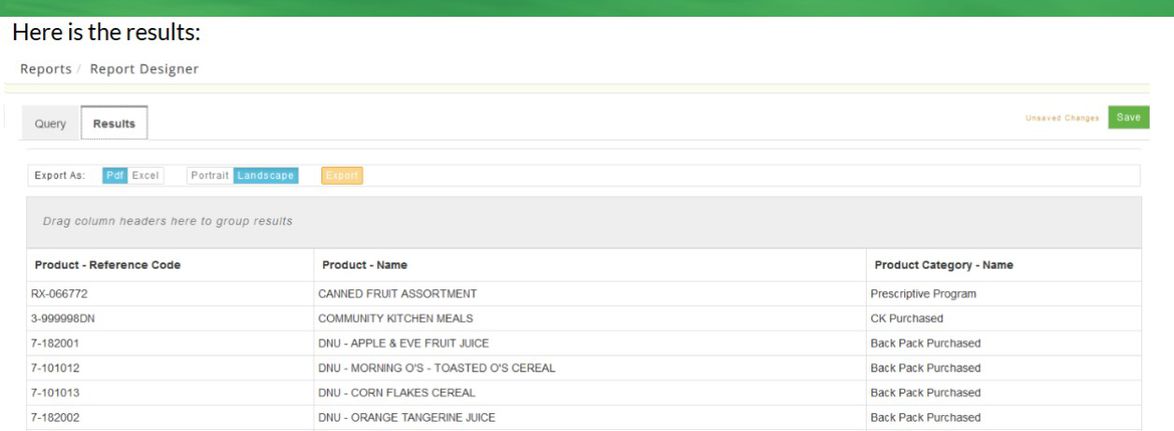
To run the report click on the green lightening symbol to Execute a report. If you hover over the lightening symbol a option will display to Only execute a sample (This returns only a sample of the requested data including 10 line items in case you just want a sample of the report to ensure you have what you're looking for).
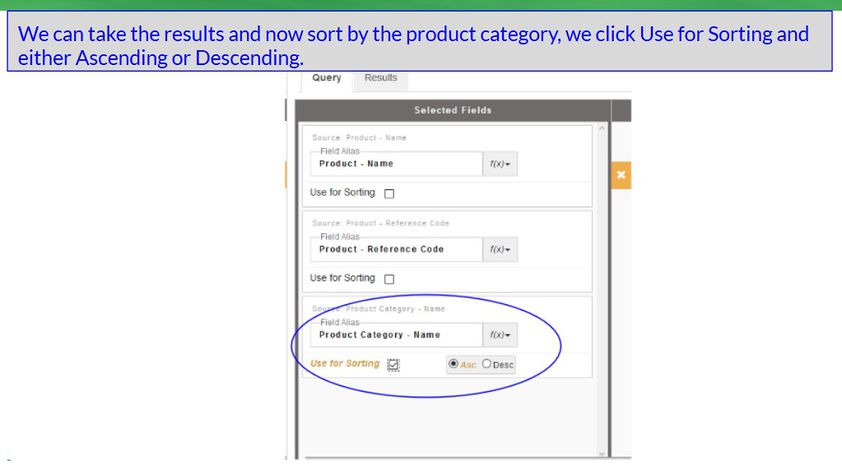
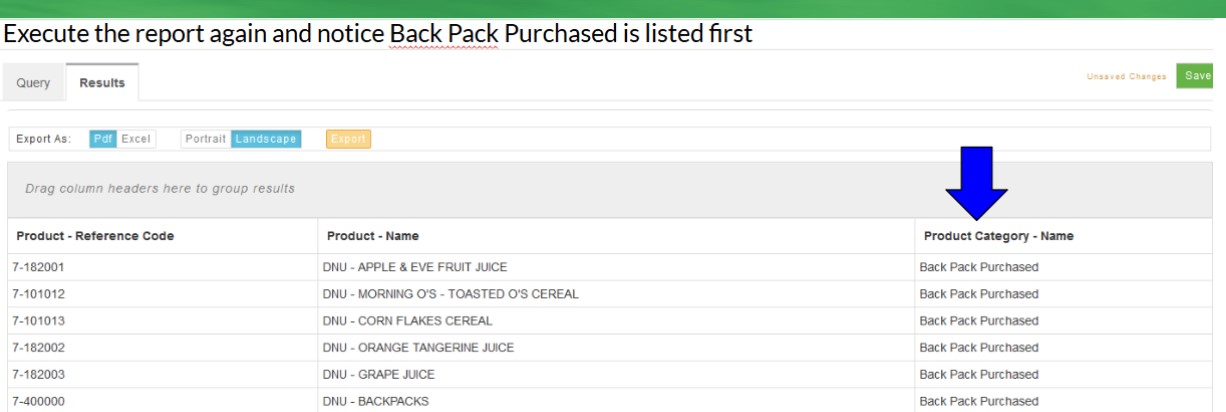
Below is a basic product/product category report with the filter to only show Purchased Products and to sort by the product category. We started by creating a food bank report and selected Product and then Product Category. (You can easily change it to exclude purchase products or display any other product category without creating another report.) If you select the quick start link at the top of this page there are more sample reports to view.
Filters:
Anything date related can have a Start and/or End Date.
Filter on something specific, if Agency is part of your report you can filter to choose just one Agency or Agency Activity if that is one of the elements (e.g. pantry).
Filter to exclude something using Not Equal To or if you use Contains and set it to False meaning if it contains the word "" then don't return it in the results. Most reports that you run that have the Agency element you should use a filter Not Equal to Inactive because P2 will return all agencies whether it's inactive or active if you don't filter on Inactive.
OTHERS:
Count, to use this feature you need to add another field that you can use for the count. Select count and the total will display at the bottom of the page.